Exciting news! Going forward, the European Conservative will offer two comprehensive economic analyses per week. Called “Fiscal Forecast: America” and “Fiscal Forecast: Europe,” they will cover the two main Atlantic economies on a regular basis.
We will also begin offering a weekly podcast where we go deeper into the issues brought up in the Fiscal Forecast articles.
As the name gives away, our main focus will be on predicting how our indebted governments will manage their debt costs going forward. Our analysis will bring in the macroeconomic perspective, the international financial aspects, and all other important economic and political variables.
We start off with the first issue of Fiscal Forecast: America.
—
Americans have lived through a winter with a nightmarish economic scenario hanging over their heads: the threat of a recession that causes a massive debt crisis. High inflation elevated the risk for a recession, on top of the risk for a debt crisis. With interest rates rising in response to both tighter monetary policy and high inflation, the U.S. government was steaming straight into a debt-cost explosion.
Since America has never faced a debt crisis of the European or Latin American kinds, neither taxpayers nor politicians in America have any idea what this would mean. Interest in the subject was lukewarm at best, even as interest rates on U.S. Treasury securities began rising in March of 2022. The benchmark 10-year Treasury note went from just below 2% in the first three months of last year, to 4% in October. The one-year Treasury bill made an even more startling climb, from 0.5% in early January to over 4.5% by mid-October.
When the 2023 fiscal year began on October 1st last year, the U.S. government was looking at an average interest rate on its debt of 1.87%. That is a very low average rate for a government whose debt is bigger than the entire gross domestic product of its country’s economy. That rate just had to go up, and it did: halfway through the fiscal year, on April 1st, the average rate was 2.44%.
Just as a hint of where this was going: in the fourth quarter of 2022, the federal government’s cost for interest on its debt increased by a staggering 42% over the same quarter in 2021.
If the debt-cost rise would continue at the same pace it had in late 2022,by the end of the fiscal year, in September 2023, Congress would have paid $1 trillion in interest to its creditors. That could have made the government debt the second-costliest item in the federal government budget.
This is a frightening number from a fiscal viewpoint; to a member of Congress, especially a Democrat who always votes for more spending, the $1 trillion threshold is a political disaster. It could help sink their chances in the 2024 election.
As of today, though, it looks like we will not reach the $1 trillion mark, at least not for the 2023 fiscal year. When the Silicon Valley Bank imploded, the interest rates on U.S. debt stopped rising. The 10-year Treasury note, which stood steadily at 4% prior to the bank collapse, began declining and paid 3.3% on April 6th. As of April 10th, it was up to 3.41% again.
Yields generally have become volatile and more difficult to forecast. One reason for this is that the Federal Reserve, the central bank whose official policy it is to not buy U.S. debt, has started a program that encourages commercial banks to buy more of that same debt. On March 12th, the central bank announced a new debt-buying initiative called the ‘Bank Term Funding Program’ (BTPF). This initiative allowed banks to borrow money from the Federal Reserve using their holdings of U.S. Treasury securities as collateral.
In reality, this program is aimed at encouraging commercial banks to buy government debt. Already on March 22nd, just over a week after its inception, the BTFP had doled out more than $32 billion for this very purpose. However, the central bank is ready to give banks as much as $2 trillion in “liquidity relief” through the BTFP, which of course is an enormous injection of cash into the U.S. debt market.
It would also be like pouring gasoline on an inflation fire that has been fading away in recent months. The Fed must be aware of this; it is inconceivable that its leadership has suddenly forgotten the reason why it started raising interest rates in late 2021. Therefore, there is really only one reason why they would do this, and it is not to save the banking system. It remains solid, showing practically no contagion effects from the SVB collapse.
The reason why the Fed wants to start putting money back into the U.S. debt market, using commercial banks as go-betweens, is that they want to dampen the cost hike from the federal government’s massive debt—and prevent that cost from crossing the magic $1 trillion line.
In short, it looks very much as though the Federal Reserve has injected itself into the political debate going into next year’s presidential election. This is of course unacceptable, but with a board that is appointed by Congress and the president, and with Democrats in Congress being notoriously unwilling to consider any spending restraint, the political realities are what they are.
Those who have wished for the Fed to re-enter the U.S. debt market can celebrate the new program using banks as debt-buying middle men, but they may soon choke on that celebration. In addition to the inflation that would come on the heels of the Fed’s new money-printing scheme, there is also the threat of a recession. If one happens, the U.S. economy could be hurled into a real, deep, and protracted stagflation episode.
A recession is less likely now, though there were worrying signs in the GDP numbers from the fourth quarter of 2022. Business investments fell by an inflation-adjusted 4.8% from the same quarter in 2021. Construction of new homes fell by more than 19%, on top of a 14% decline in the third quarter.
Businesses reduced investments in new structures, though the reduction was less than 1%. In the previous quarters of 2022, the reductions had been much bigger.
At the same time, businesses continued to increase their purchases of equipment and so-called intellectual property products (primarily computer software). The continued increase in these two categories suggests that at the end of 2022, business managers expected a good 2023.
A look at the labor market suggests that they continue to be optimistic. There are no signs of recession-level layoffs. In March,
Despite this good news, there are reasons to worry about U.S. government finances. Even if the economy remains strong, there is a structural imbalance between government spending and the ability of the economy to pay for it. Relative to the size of government, America has fewer taxpayers today than at the turn of the millennium.
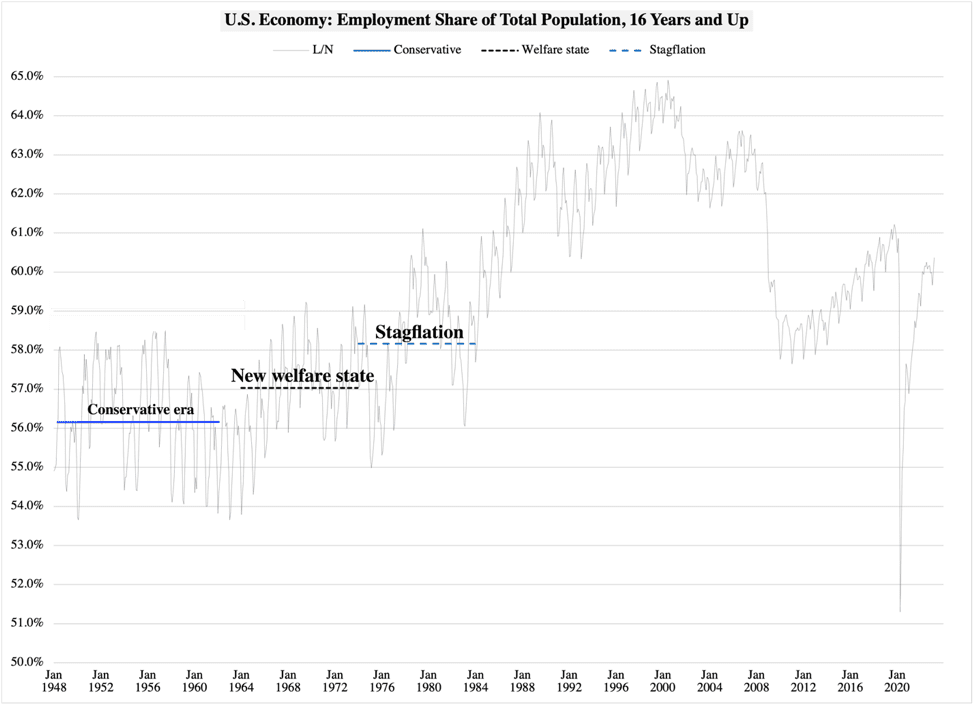
Part of the reason for this is, of course, the growth in government. Part of it has to do with a recent decline in the willingness among Americans to work. Figure 1 reports the employment rate per month, all the way back to 1948. In the 1950s and early 1960s, the United States did not have a big, economically redistributive welfare state. Federal, state, and local government spending totaled 24% of GDP.
With taxes at the same level, many families could live on one income. An average of 56.2% of the working-age population 16 and older were employed.
Figure 1

During the conservative era, America had the welfare state created under President Franklin Roosevelt. Its benefits were almost exclusively reserved for those who had no other means of supporting themselves. That changed in 1965 with President Lyndon Johnson’s War on Poverty and a new welfare state. Its programs were increasingly designed to give benefits to those who were gainfully employed.
With those new entitlement benefits came higher taxes. A decade after President Johnson’s reforms began, the tax share of the total economy had risen from 24% to 30%. This forced Americans to work more just to pay their bills: the average employment share increased, averaging 57% for the period 1965-1974.
Then came the stagflation era. The tax code at this time did not raise the income thresholds with inflation. As taxpayers migrated into higher tax brackets, government chewed away at their paychecks on one end and inflation on the other. Even more families were forced to live on two incomes, pushing the employment rate above 58% for the stagflation years 1975-1983.
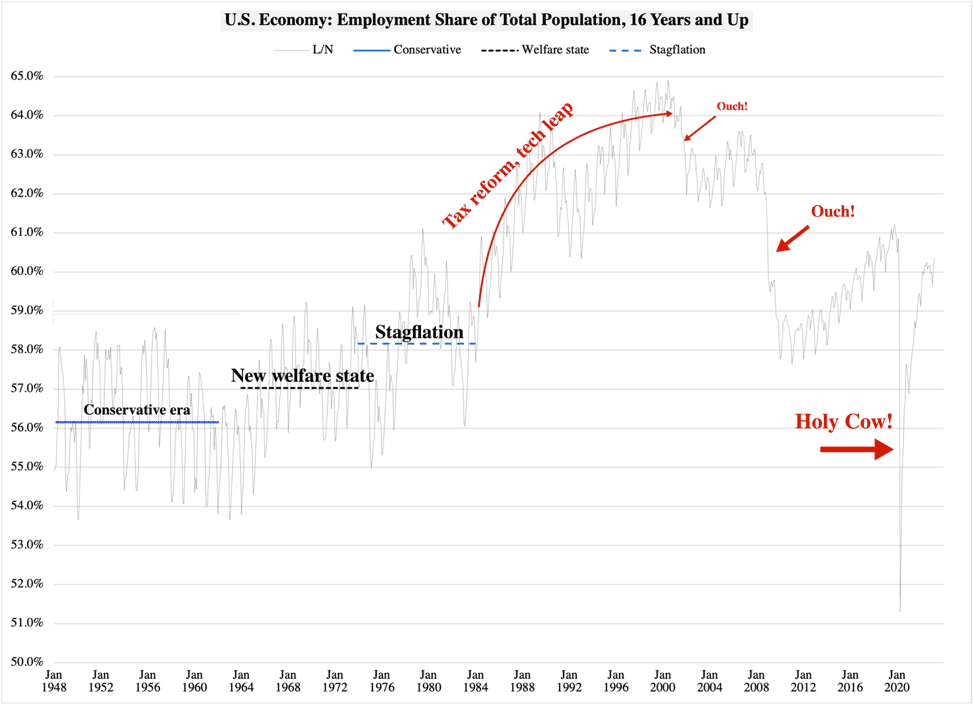
While inflation subsided, President Reagan began working on his revolutionary tax reform. The number of brackets—different tax rates—in the federal income tax code fell from 15 to 2; the top income tax rate was reduced from 50% to 28%.
Employment rose again, but now for a very different reason: it actually paid to work. From 1983 to 1989, the rate of employed Americans aged 16 and up increased from 58.7% to 62.9%.
After a brief recession in 1990-91, the U.S. economy took its first major computer-technology leap. The desktop, the laptop, the cell phone, and the internet all entered the economy. President Clinton added inflation protection to the tax code, which helped encourage even more people to find a job. From mid-1997 to the summer of 2000, the employment rate exceeded 64%.
That was as good as it got. First came the Millennium recession, then the crisis in 2008-2010, and most recently the pandemic:
Figure 2

In 20 years, America has lost almost all the employment rate gains from the 1980s and 1990s. If that rate had been the same today as it was in the late 1990s, then 11 million more Americans would be working today. That would be 11 million more taxpayers to fund the government. They would be needed, as government is massively bigger today than it was at the turn of the millennium:
With the same ratio as in 2000, the total bill for government spending would have been $1.5 trillion smaller. With the same employment rate, there would have been 11 million more taxpayers available to foot the bill.
Or, put differently: if government size and employment rate had been the same in 2022 as they were in 2000, the cost of today’s government would have been $47,000 per employed person. That is a lot of money—until we do the same arithmetic with today’s government size and employment rate. Then the cost comes out to $59,700.
Plain and simple: America’s government sector is 27% more expensive to the working men and women than if government and the labor market had been the same as at the start of the millennium. Even worse is the fact that the cost of government per working American has increased by 153% since 2000.
Total inflation over that period of time was less than 71%, which goes to show just how much government has grown in the past two decades.
In fairness, not all the $59,700 falls on each taxpayer today. There is the deficit, which comes out to $6,900 per taxpayer, or 11% of total government spending. At the same time, that borrowed part is what makes the size of government so problematic: as of April 7th, the total U.S. government debt was $31.46 trillion; if that does not rise, and if interest rates stay unchanged, that means an annual interest cost for the federal government of $768 billion.
However, there is a good chance that the annual bill will climb past $900 billion for the 2023 fiscal year (ending on September 30). The $1 trillion threshold is coming closer.
In order to just stop borrowing, i.e., to get back to a balanced budget, Congress will have to reduce spending and raise taxes by a combined 11% of current spending. This is a downright scary scenario for a legislature that defines a slowdown in the growth of spending as a spending cut—yes, that’s true! Congress uses so-called ‘baseline budgeting’ where automatic spending increases are built into the appropriations process. If actual spending grows more slowly than stipulated by the automatic baseline increase, Congress defines that slower increase as a spending cut.
While Republicans in Congress have started a conversation about how to rein in spending, Democrats act as if they can go on spending and borrowing money forever. With Congress virtually divided in half between them, there is little to hope for in terms of productive reforms. It looks more and more as if America will have to go through a real Greek-style fiscal crisis before her political leadership wakes up.
