
Lower interest rates are indeed on their way. That may be hard to believe, but they are coming, in America as well as in Europe.
When it comes to interest rates, the market for U.S. government debt tends to lead the market for euro-denominated debt. Therefore, it is good news for all of us that interest rates, or yields, on U.S. Treasury securities are on their way down.
On Wednesday, December 12, the U.S. Treasury sold $21 billion worth of 30-year bonds at a median interest rate of 4.28%. This is still a high rate by historical comparison—In December 2020 the interest rate at the same auction was 1.79%—but it is a major drop from the two most recent auctions under the same maturity:
This was not an isolated drop in Treasury yields. The December 11th auction of $37 billion worth of 10-year notes produced a yield of 4.22%. The October and November auctions paid 4.53% and 4.44%, respectively.
Under the 3-year maturity, the October auction’s yield of 4.67% was followed by 4.65% in November. At the December auction, the yield fell to 4.43%.
Shorter maturities, i.e., bills and notes that mature in anywhere from 4 weeks to 2 years, exhibit a weaker downward trend. Bills up to six months are all stabilized in the 5.16% to 5.23% yield range. In mid-October, they all paid 5.3% or more.
As odd as it is that shorter maturities pay more than longer maturities, there is actually good news in this so-called inverted yield curve. Investors expect the Federal Reserve to keep the federal funds rate—their policy indicator—unchanged over the winter. Without any significantly negative economic news between now and February, I would expect the Federal Reserve to make its first cut in the federal funds rate in March or April.
The decline in yields at the Treasury auctions is one good indicator of where interest rates are heading; another good source of information is the secondary market for the same securities. This is the market where investors who own U.S. debt can sell it before its maturity date; those who cannot get in at the auctions can buy government debt here.
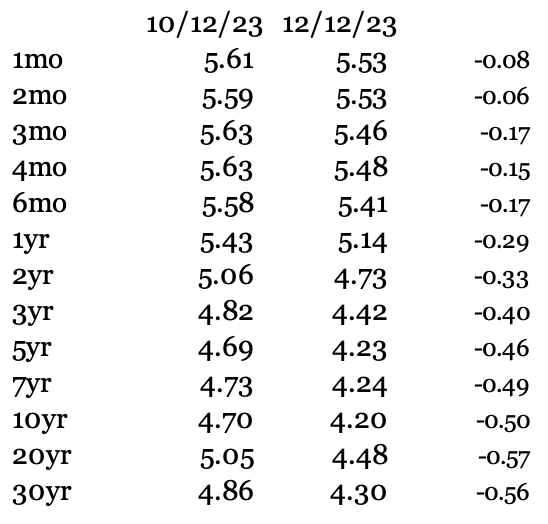
Table 1 reports the change in daily auction yields over the past two months for every maturity class that the U.S. Treasury provides. While yields have dropped across the board, the declines for longer maturities are significant:
Table 1
Given the overall downward drift in yields on sovereign debt, and the GDP numbers I discussed yesterday, it is difficult—to say the least—for the Federal Reserve to raise interest rates. The big forecasting problem is instead to assess when they will begin cutting rates, and at what pace.
The foremost indicator for the Fed is inflation. It started declining as a direct result of the Fed’s monetary tightening almost two years ago. It is still coming down: on December 12th, the Bureau of Labor Statistics announced that annual consumer-price inflation in November is now down to 3.14%. This is two ticks below the 3.16% that we get from the GDP deflator; these two numbers, while calculated differently, corroborate one another.
It is important to note that all is not well on the inflation front. It increased suddenly this fall: after 3.2% in July, it shot up to 3.7% in August and September, only to fall back down again.
With inflation stabilized at moderate levels and an outlook that cautiously suggests lower interest rates to come, the Fed has a good reason to start cutting its federal funds rate next year. The only problem in this outlook is the fact that while the Fed is expected to cut interest rates, it is also expected to continue reducing the money supply. Basic monetary theory prescribes that these two policy goals are mutually exclusive, but we don’t even have to go to the textbooks to see this. When interest rates fell drastically in 2020, it was entirely because the Federal Reserve printed tanker loads of money within a short period of time.
Figure 1 reports the U.S. money supply as a share of GDP. The numbers are quarterly, which makes the money supply look large relative to GDP; let us keep in mind that the money supply is a stock while GDP is a flow. The striking part of Figure 1 is that which begins in 2008. That was the point in time when Federal Reserve Chairman Ben Bernanke began his so-called quantitative easing—a fancy term for printing lots of money and buying lots of government debt for it.
However, the rise in money supply relative to GDP that Bernanke initiated was nothing compared to what the current chairman, Jerome Powell, presided over in 2020:
Figure 1
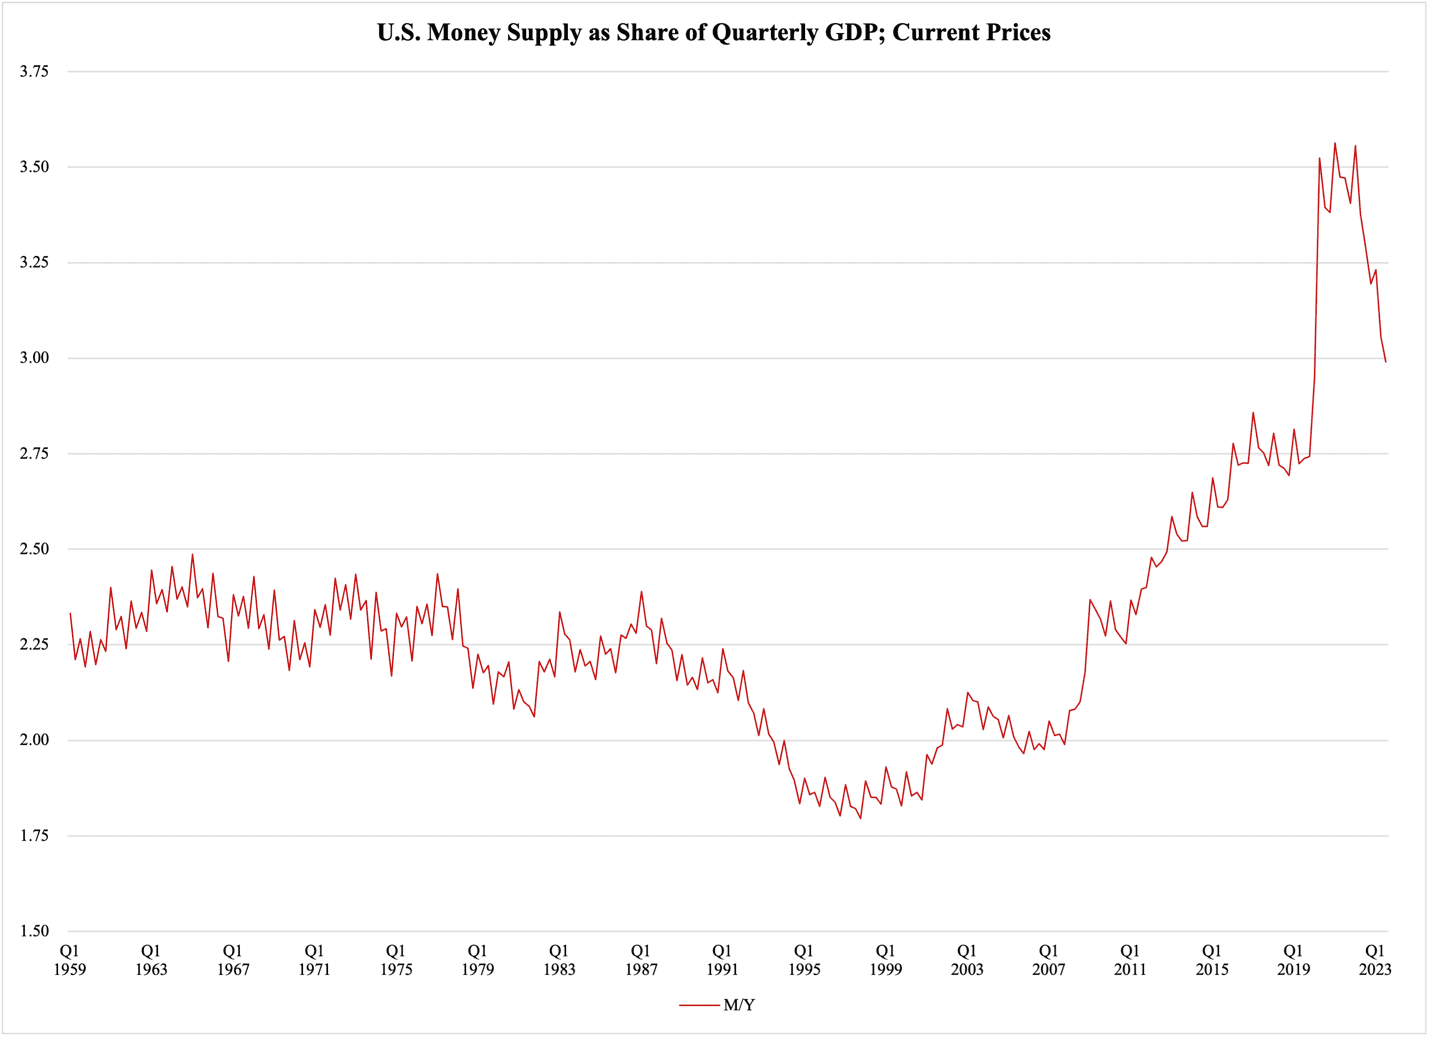
The money supply growth in the past 15 years is glaringly irresponsible, but the key part of Figure 1 is the very recent monetary contraction. With the money supply (measured as M2, for all you nerds out there) at $20.67 trillion, we are now back to the same money supply that we had in the summer of 2021. This is a welcome decline, yet a modest fall from the top at $21.8 trillion in March and April last year. We still have a long way to go to get back to the erstwhile 2.2-2.5 money-to-GDP ratio proportionality.
If the Fed intends to continue reducing the money supply—and so far we have no reason to expect otherwise—they will have to perform an interesting balancing act where they also bring down interest rates. They will get some help from the markets, where investors are removing expectations of high inflation from their yield demands, but that help ends when inflation aligns with expectations.